Robotics Dashboard Design - Precision at Every Production Step
Hyperfab Dashboard - A centralized system for monitoring and optimizing robotic operations in industrial environments.
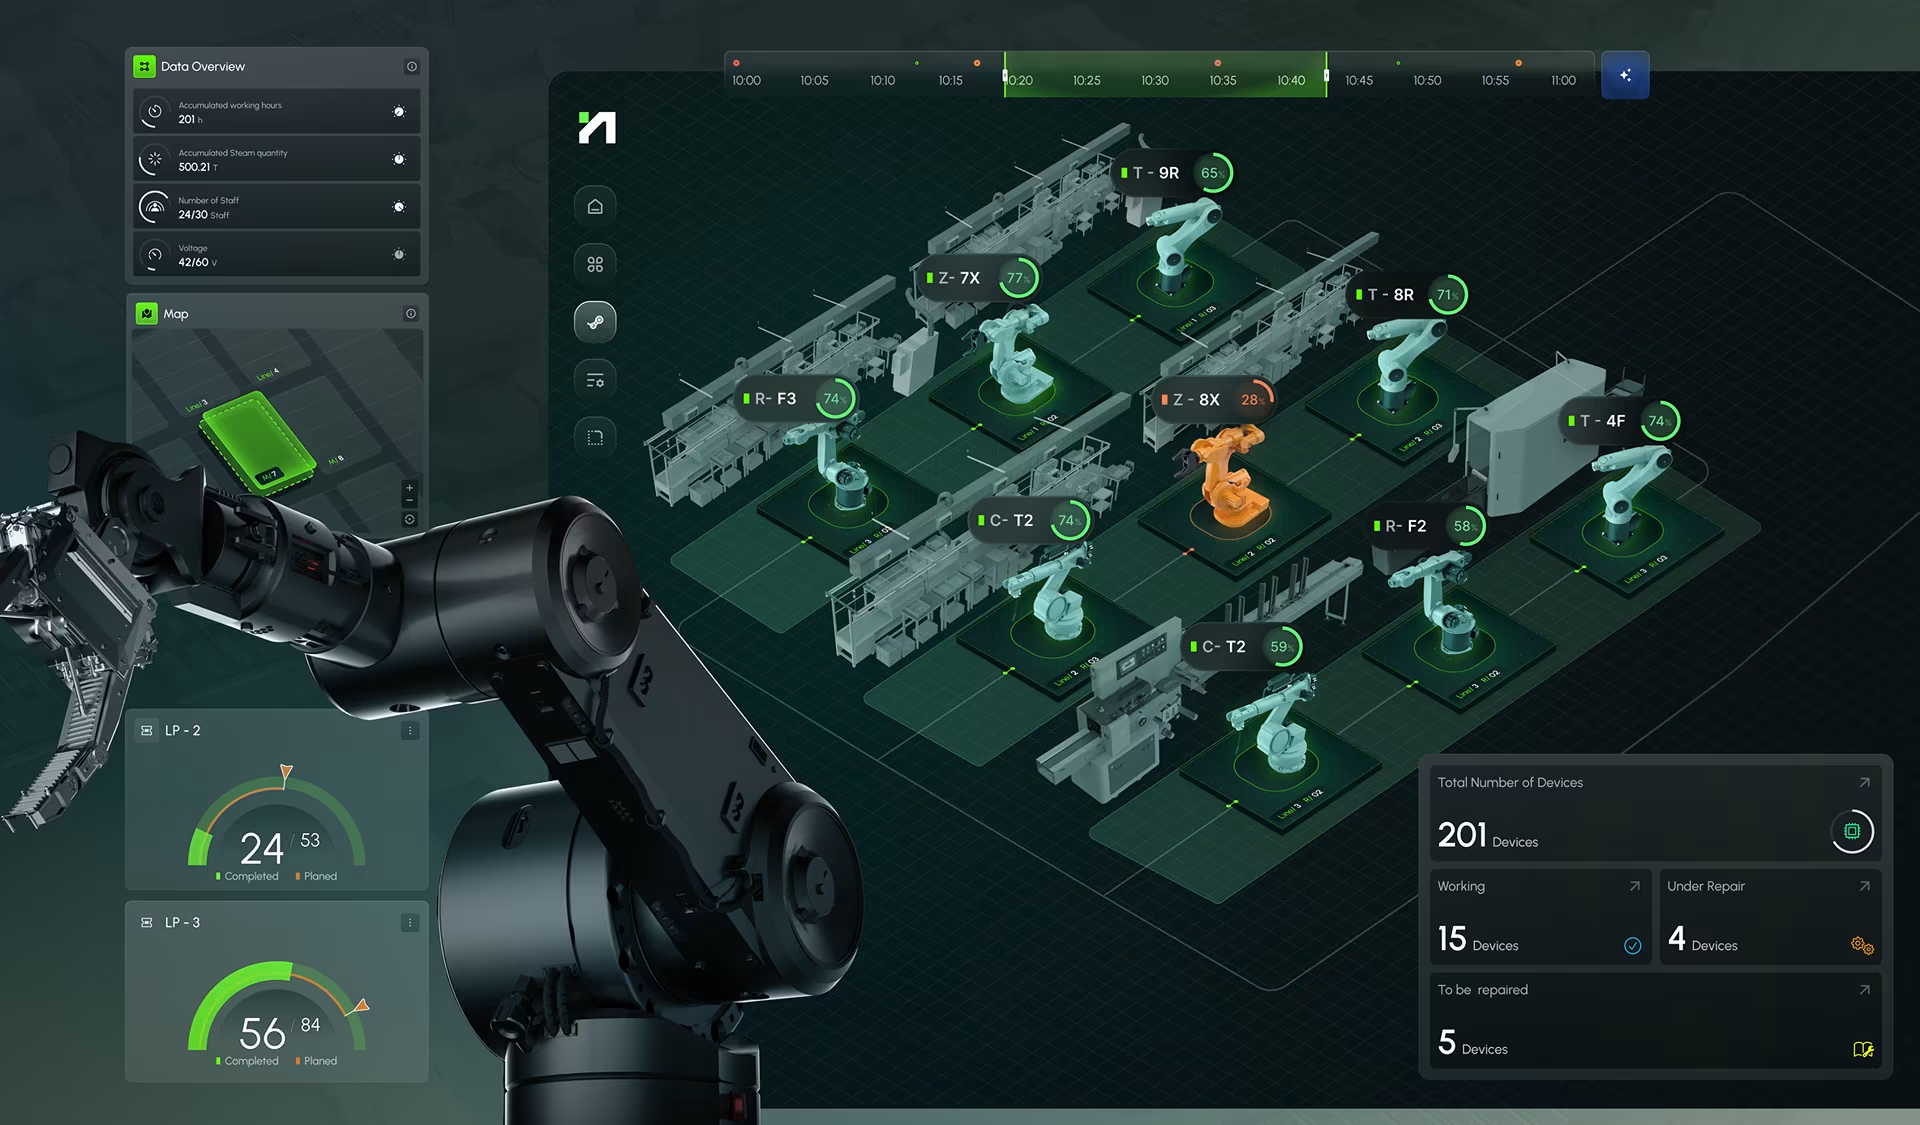
The robotics dashboard design case study below depicts a consolidated summary of key performance indicators for various types of factory operations and industries. Core metrics such as accumulated robot working hours, steam usage, energy levels, and active staffing provides users with a super clear picture of their workplace’s productivity and real-time resource allocation.
Factory
Performance
Overview
Robotics Dashboard Design
In our opinion, the success and failure of an interface design for any factory environment must first include a focus on incredibly intuitive status displays using universally understood visual cues like color coding (green for normal, yellow for warning, red for critical), clear typography, and logical information grouping.


AI Simulation &
Workflow for Robotics Dashboard Design
Our manufacturing performance overview robotics dashboard design integrated an AI assistant, which enables prompt-based simulation of robotic processes, such as cutting, labeling, or assembly. Users can preview detailed animations—like the motion path of a cutting arm—complete with timeline controls and interactive playback tools.


Collaborative
Equipment
Tracking
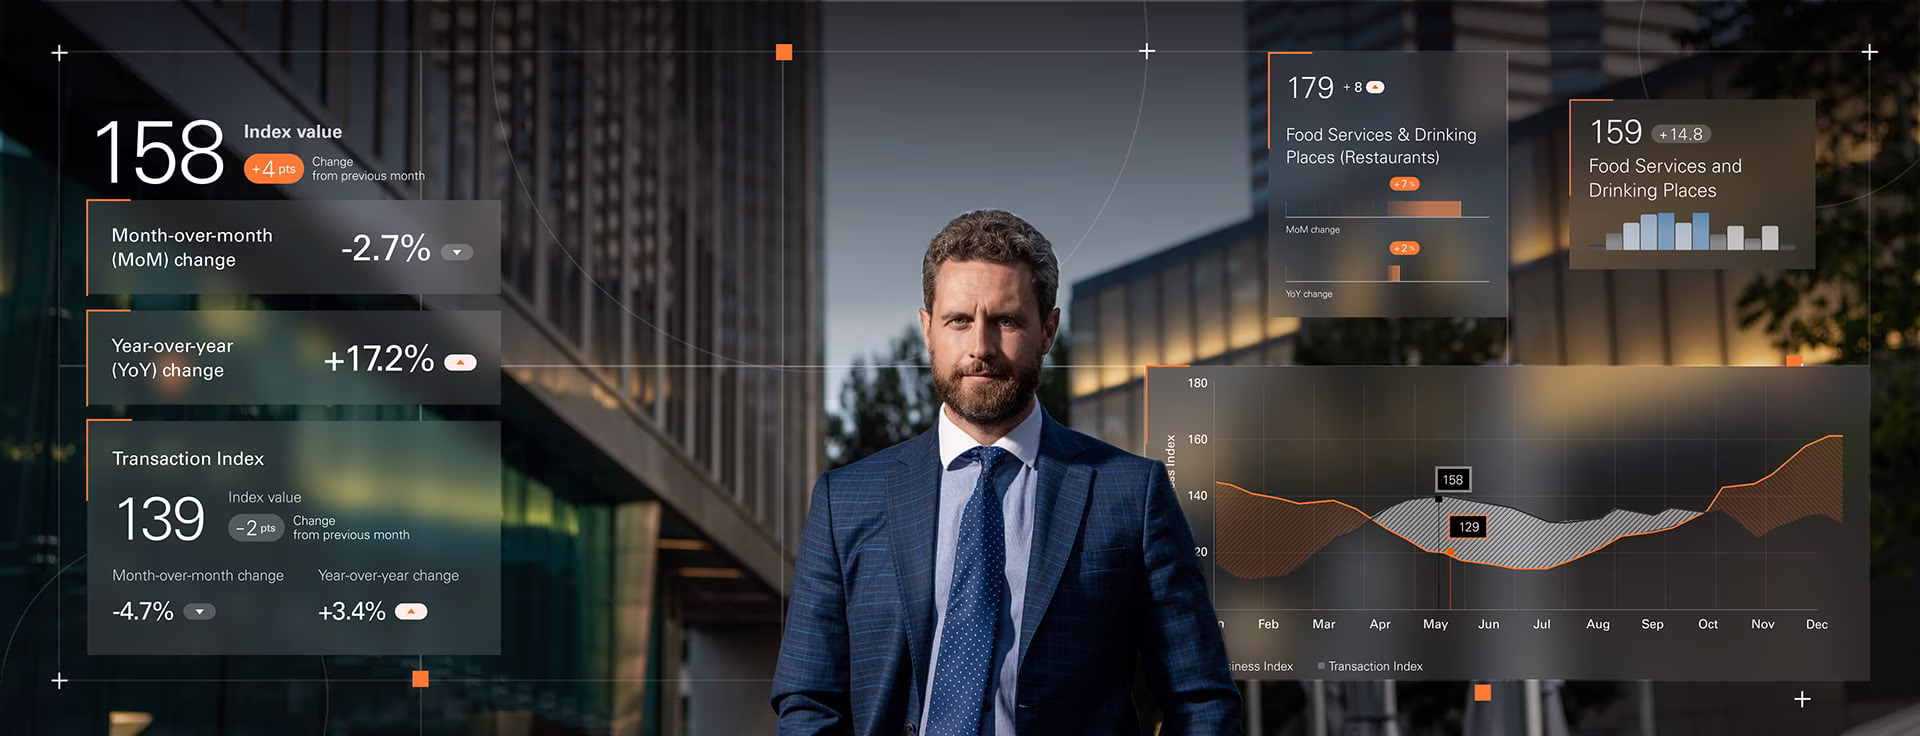
Our design focuses on process tracking and in particular, how robotic equipment is performing individually and collectively across the production environments. The fact that our metrics are delivered in real-time allows for amazing comparison metrics between actual output vs. target output, with historical and monthly trends offering insight into long-term performance.
This chart highlights the monthly progression of all the active equipment outputs, comparing actual performance to preset operational targets. Users can easily and quickly identify trends, evaluate seasonal shifts in productivity, and monitor how effectively equipment is meeting performance expectations across the year.
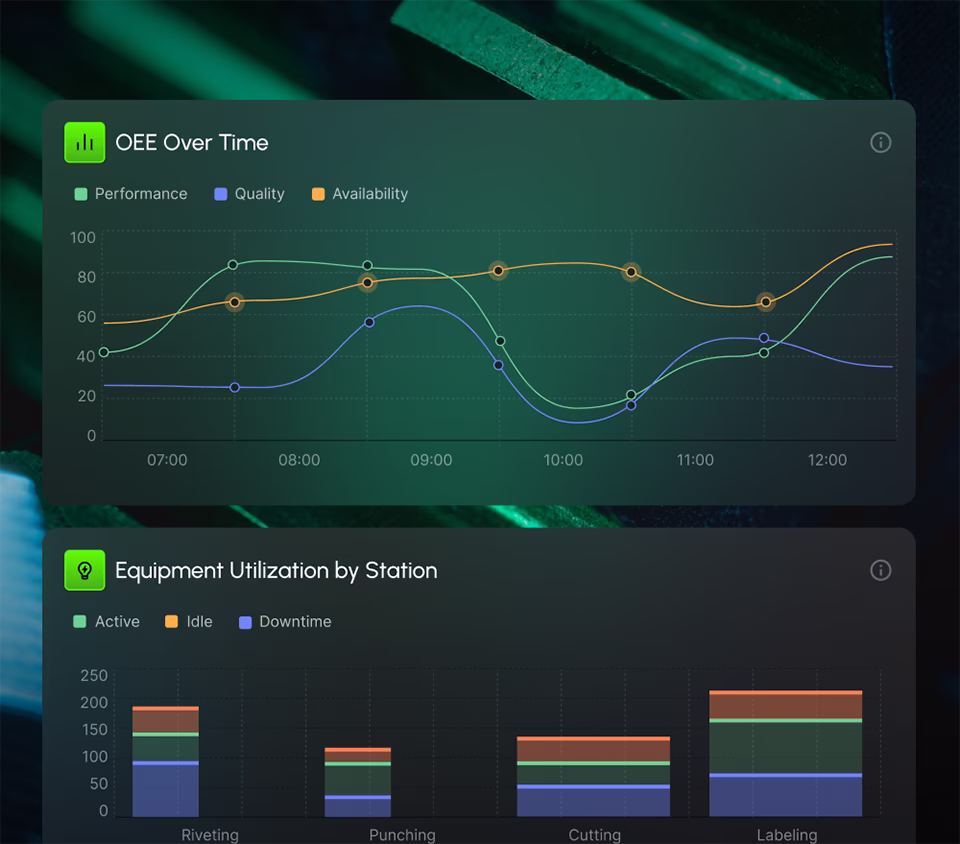
This production monitoring robotics dashboard design graphics provide managers with a comprehensive view of equipment health and usage. The OEE graph breaks down Performance, Quality, and Availability metrics hour by hour—helping diagnose inefficiencies at the root.
Calibration &
Control
This project design required allowing users the ability to select individual devices by type — such as Cutting, Riveting, or Labeling — and make real-time adjustments to positioning, rotation, and assignment. The interactive 3D model provides clear visual feedback during calibration, enabling fast identification and intuitive adjustments.

Robot Task &
Monitoring
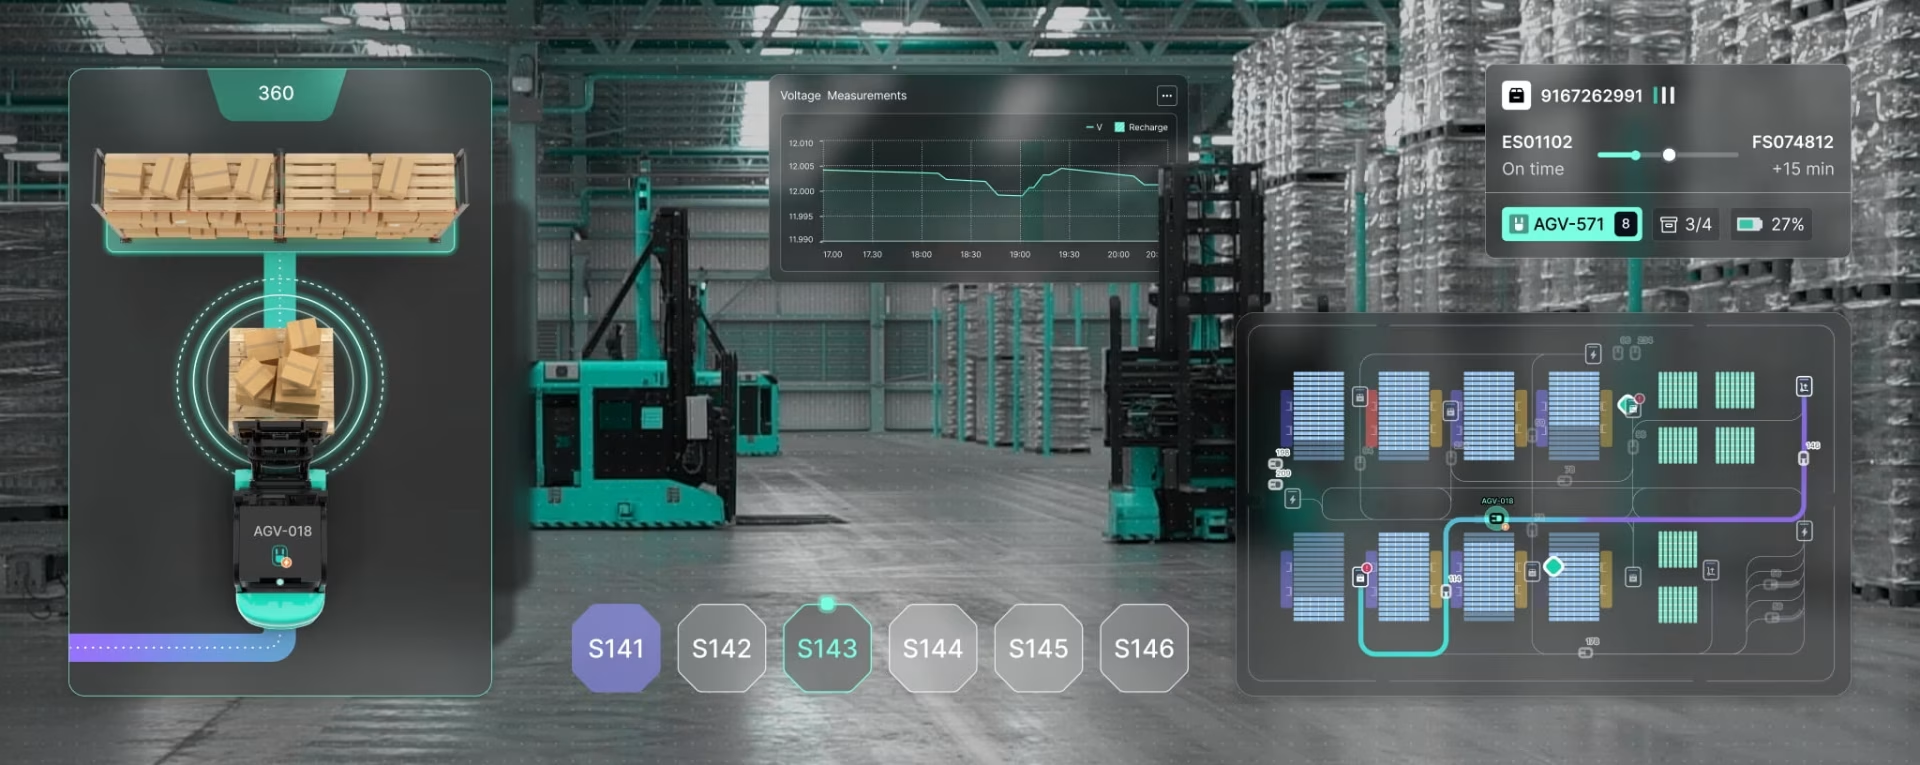
With a real-time interface, operators are supplied with robotic arm performance oversight during cutting operations along a conveyor line. A top-down visual displays exact tool movement while offering instant control through Free Run, Pause, and Stop states.
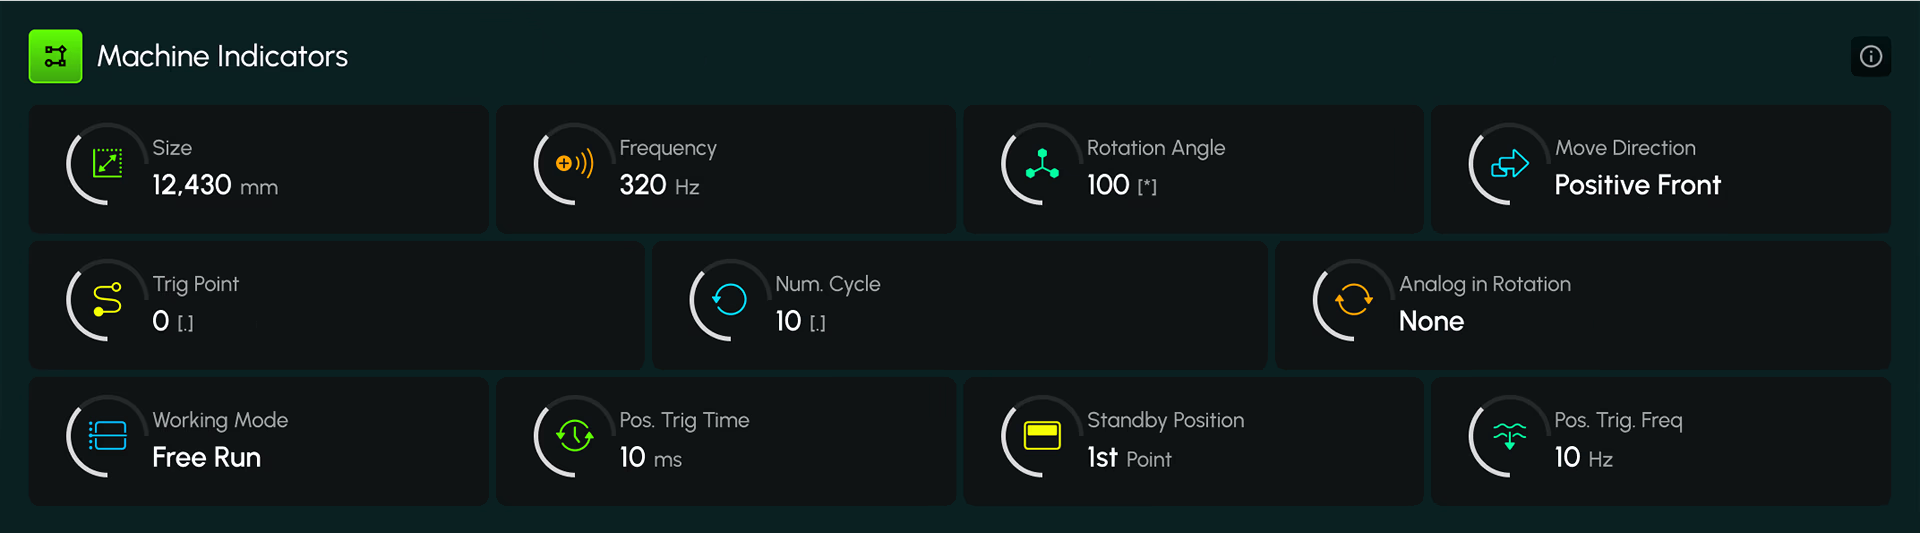
It’s one thing to monitor robotic arm movement with data displays; it’s an entirely different experience when proper iconography, color-based indicators, and visual cues are used to give managers a split-second insight into the entire operation. In terms of cost-cutting, productivity, and efficiency, our robotics dashboard design is essential.
Designed by:
Art Direction
George Railean
Project management
Vladimir Bobu
Design
Lina Ghimp, Vitalie Ghimciuc
Robotics Dashboard Design - Interested in creating something similar?
Get a free estimation for your project requirements and start it within 24 hours.
Related Services and Solutions
Don't Listen to Us, Read What Our Clients Are Saying.
We know that trusting an outsider with your vision can be scary. This is why if you're not satisfied with us after the first two weeks, you can walk away owing us nothing.
"We went from prototype to usable software lightening fast, and our customer reviews have never been better."
"Their creativity and mastery of UX UI design has made our years of working together enjoyable and incredibly successful!"
"If you need to re-think your product and need some truly unique design talent , Fuselab Creative design team is your answer."
"We needed a nimble team of UI UX designers to work with our development team and they quickly became one of our most vital resources and far exceeded our expectations."